
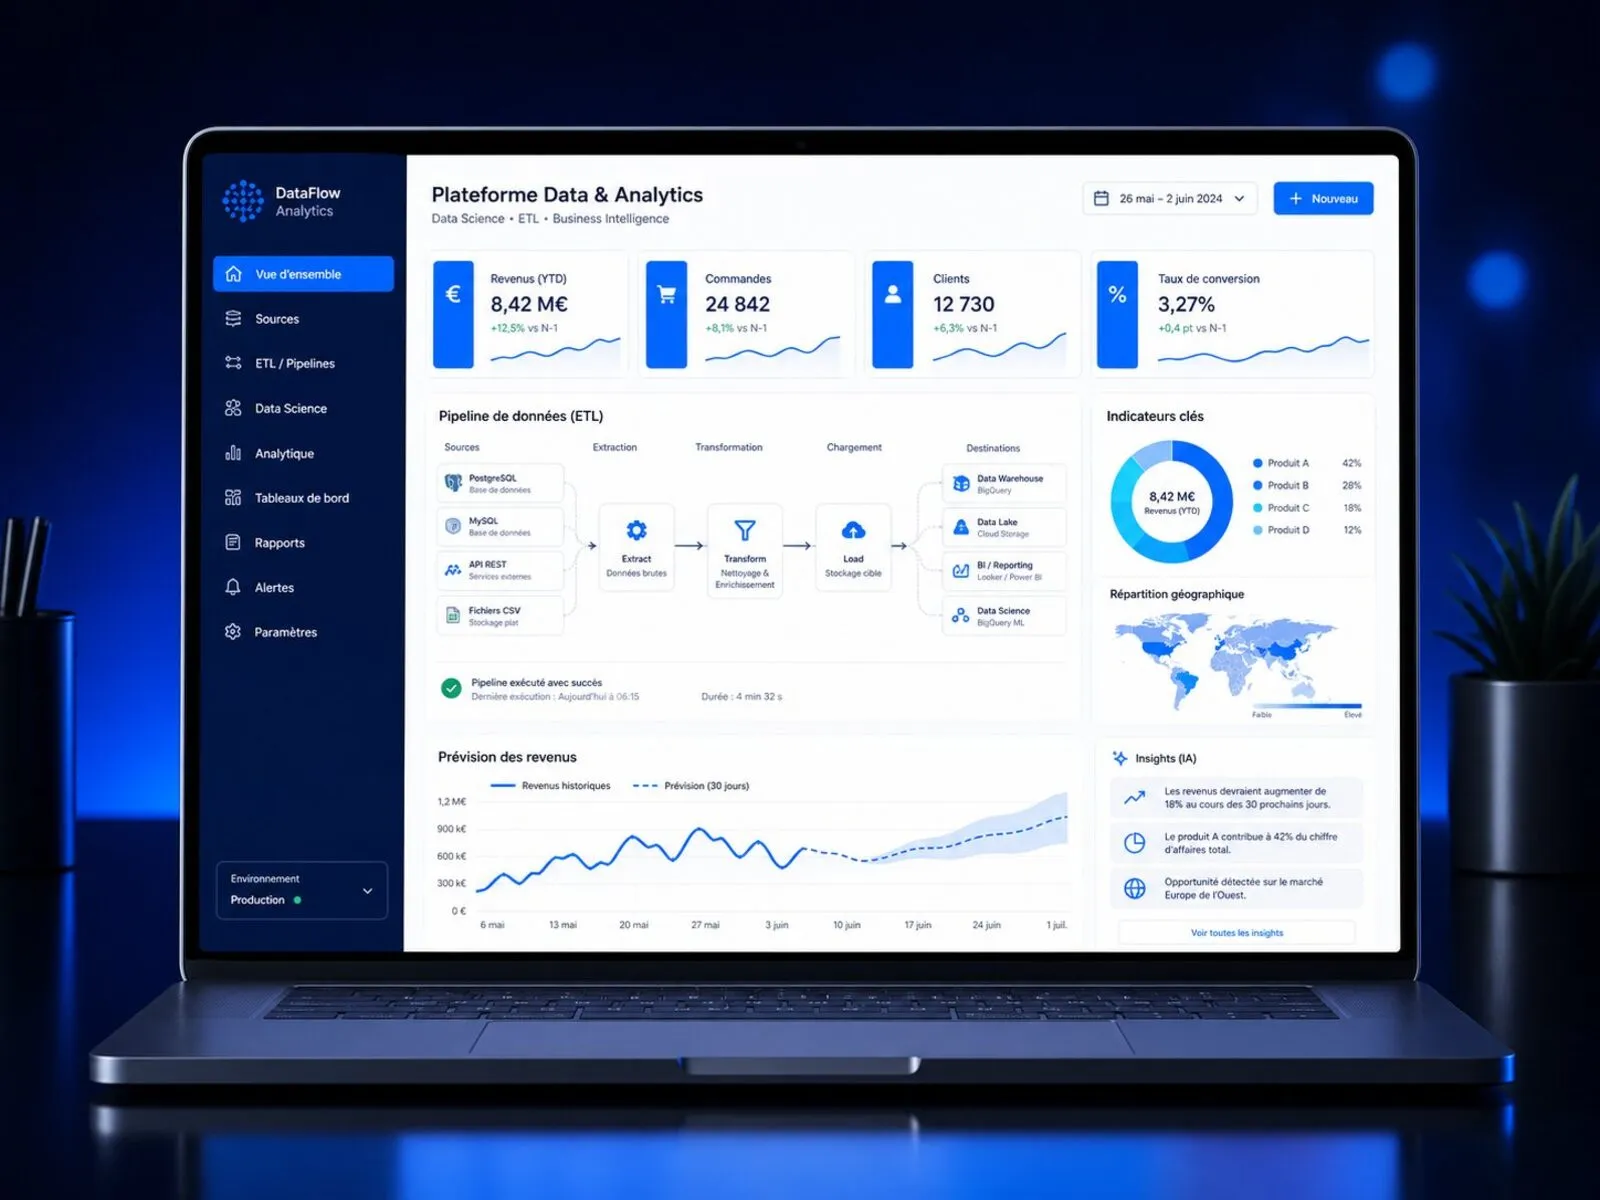
In most SMBs, the numbers already exist: quotes in the CRM, invoices in accounting software, orders in the online shop, billable hours in scheduling tools. Yet every month-end, executives or finance leads still lose half a day copy-pasting CSV exports into Excel — where one broken formula can skew a major decision. Here is how to move to reliable, automated real-time visibility.
Why manual spreadsheets eventually hold back growth
Spreadsheets remain great for ad-hoc scratchpad calculations, but quickly break down once used as a company’s central multi-team database.
3 warning signs inside growing SMBs
- Conflicting numbers in Monday meetings: sales revenue reported in the CRM never quite matches accounting invoices or actual cash collected.
- Looking in the rear-view mirror 30 days late: waiting for monthly close prevents catching margin slippage on a project, rising acquisition costs or impending stockouts in time.
- Single-person spreadsheet risk: a fragile 15-tab macro workbook built three years ago that nobody dares touch.
What Business Intelligence (BI) changes in practice
A live BI dashboard connects directly to your existing business software via secure APIs or SQL connectors. Overnight — or every 15 minutes when operations require it — data is extracted, cleaned, reconciled and displayed as crystal-clear KPIs on desktop and mobile, with role-based permissions for each manager.
Which KPIs belong on an executive SMB dashboard?
An effective executive cockpit never drowns readers under fifty charts — it answers “Where do we need to act this week?” in under 30 seconds.
Finance, cash flow & net profitability
- Signed, invoiced and collected revenue tracked side by side against forecast.
- Gross and net margin broken down by product line, client segment or job site.
- Accounts receivable aging (DSO), overdue invoices to chase first and 30/60/90-day cash-flow runway.
Sales pipeline & digital acquisition
- Inbound lead volume by channel (organic Google SEO, campaigns, referrals), quote win rate and average sales cycle.
- Average order value, repeat purchase rate and customer lifetime value (LTV) if you run an e-commerce store.
Operations, utilization & inventory
- Team billable utilization and variance between quoted hours and actual hours logged.
- Inventory turnover, slow-moving stock tying up working capital and automated reorder alerts.
Pragmatic Data Architecture for SMBs: from first KPI cockpit to predictive AI
You do not need Fortune-500 enterprise bloatware to run clean data. Our Data Analytics, Engineering & BI practice deploys right-sized, GDPR-compliant architectures hosted in Europe:
| Tier | Who It Fits | Concrete Deliverables | Starting Price (excl. VAT) |
|---|---|---|---|
| Data Audit & BI | SMBs wanting a reliable first executive KPI cockpit | Data cleaning, 1 to 3 source connectors (CRM, invoicing, web) & interactive live KPI dashboard | From 1 900 € |
| Data Engineering & ETL | Multi-tool or multi-site SMBs with growing data volumes | Automated ETL pipelines, centralized SQL/Cloud Data Warehouse, data quality checks & anomaly alerts | From 4 500 € |
| Data Science & Predictive AI | Companies forecasting demand, inventory or customer churn | Custom ML forecasting/scoring models, REST API integrated into your tools & team onboarding | From 8 900 € |
How to launch your BI dashboard in 4 weeks without overloading your team
Step 1: Start from business decisions, never from charts
We begin by locking in the 8 to 12 metrics that trigger real operational action, writing down one shared mathematical definition per KPI (for instance, exact net margin after discounts and shipping).
Step 2: Clean & automate ETL data pipelines
The invisible foundation that makes everything trustworthy: deduplicating client records spelled slightly differently across CRM and accounting, normalizing dates/currencies and storing clean historical series in a warehouse you own 100%.
Step 3: Actionable views & proactive threshold alerts
Alongside your live web dashboard (or embedded straight inside your custom business web application, from 2 900 € excl. VAT for a first module), we can configure automated weekly executive digests and instant alerts whenever a critical threshold is crossed.
How many hours every month could automated reporting save you?
Tell us which tools you currently use (CRM, ERP, accounting, e-commerce): we review your data sources and send a clear, no-obligation written quote.